CAN DATA TALK?
Modern day computer expert systems can decipher important
aspects of data even when the main headings are lost. Somebody’s phone bill can be isolated without
the name just by the pattern of phone calls made. More and more we are finding data has a
signature that does not require knowledge in great detail about the author.
Could it be that such information could have been embedded in ancient structures and be revealed in survey data? We are going to discuss just one example of a database that may speak volumes, but has been overlooked for centuries. If you haven’t read the other blogs, you might want to do that first.(see end of this blog)
Computer Modeling has shown that the individual and
accumulated heights of the layers of inner blocks that make up the Great
Pyramid are organized much more than has been typically ascribed in the
past. Perhaps the message embedded in
the dimensional aspects will develop into something that will unlock more secrets
of the pyramid builders.
Sir Flinders Petrie conducted a survey in the early 1880’s
for which he was knighted. They ought to dig him up and knight him again. I
think I would consider making him Saint Petrie. The data analysis used herein
will put to bed any question of his capabilities as a measurement specialist,
which he prided himself in being.
The Sir Petrie survey was conducted with great thoroughness;
some dimensions re-measured as many as several dozen times. The stone pavement
was used as the base and each layer height was measured up the NE corner and
the SW corner of the Great Pyramid.
The beauty of Sir Petrie’s approach is that there was
minimal accumulated error. He measured
the elevation of each layer as an individual measurement and also the
horizontal run. He further checked with
the angle from the position of the transit.
He recorded the heights only to 0.1 inch, he says, because of the
relatively uneven surfaces of the stones.
The pyramids have the unique building technique of starting
with large height stones (58 inches) and succeeding layers each a few inches
shorter until perhaps 60 percent of the starting block height. Then the height of the next layer is
increased back up several inches and the descending starts again. It is a stair-stepping pattern within a stair-stepping
pattern.
This might be the first time the change in layer height has been plotted on a double basis showing the parallel functions of the two layer sequences. It makes sense if one is to change one sequence, the other needs to follow fairly closely or else real mayhem develops in keeping the layers relatively flat. Except for the first few layers, they track almost undetectably close. Still as mathematical functions, they are very similar.

In the bottom chart the variation beyond the first few layers
vary like two musical instruments in tune. This indicates that the variation
was done on purpose and not a series of random changes. In order to see the
curve in greater detail, charts were made for the height cubed. There is some
interest in the volume of the blocks and since the base area cannot be known,
the height cubed is as close as can be done.

The charts above show that the change in block height is far
from random. The bottom is the NE corners in red and the upper the SW corners
in blue. By checking the actual data in the spreadsheet, the peaks are found at
common layers except at 99 and 100 where the peak is at one higher layer.
In the very top one can see the curves just about are on top
of each other but vary by hitting a different peak in the middle of seven
peaks. In the bottom chart six zones are marked to mimic the six hydrogen
primary wavelengths.
Note the small chart on the right represents the layers at
which the major peaks occur. Note all
are on parallel straight line relationships. Again, all this indicates there is
some fundamental design intent. The more complex mathematics is under
continuing analysis.
SIR PETRIE DATA
The data from Sir Petrie is presented in two columns of
numbers, one 203 elements and the other 201.
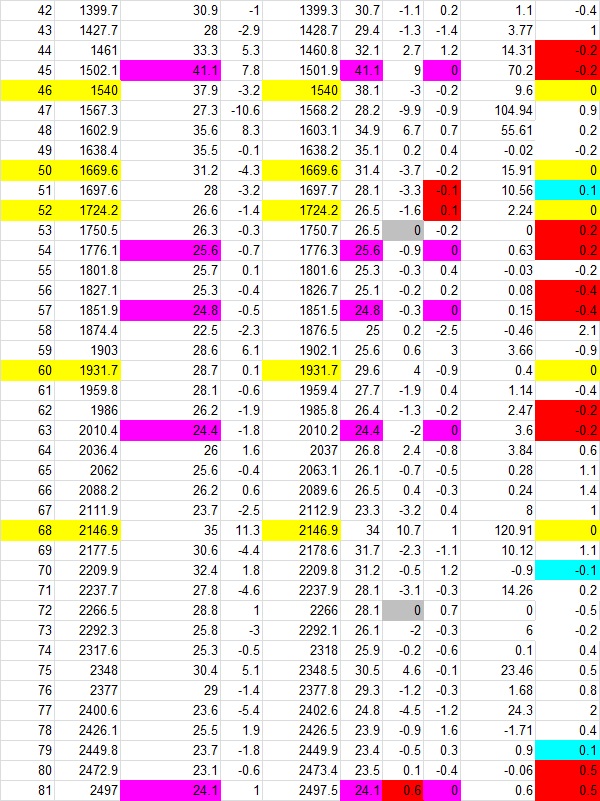
These are in the spreadsheet below marked “NE Edge” and “SW edge”. The first column is the number of the layer,
the pavement being zero height at layer “1”.
The third and sixth columns are simply the incremental block
heights for the NE and SW edges respectively. The fourth and seventh columns
show how much the block heights change from one level to the next. The eighth column is the difference between
the block height on the NE and the SW, such as 58.6-57.6 = 1.
The ninth column is the simple product of block heights from
column 3 and 5 such that 58.6 x 57.6 = 3375.36.
The tenth column is the difference in the Sir Petrie raw data of column
5 minus column 2 such as 57.6 – 58.6 = -1.00 and was used to highlight equal
elevations marked with yellow at “0.00”.
Just skim down through the data sheets for colored patterns
and do not try to read all the numbers the first time through. You should get a
sense for what is indicated.
Layer No NE accum NE each dif SW accum SW dif Product SW-NEdifference


If one assigns the computer the task of computing random
block heights and allows them to vary say plus or minus 20 inches within the
range from 20 to 60 inches, then with 1/10th inch increments there
are 400 possible block heights.
Therefore, in 201 possibilities we might expect a couple points where
one block height is the same as the one opposite on the distant corner and same
row. In actual computer models, this was proven generally true with a few
occasions when there were three blocks with the same height.
If the accumulated elevations (the raw Sir Petrie data) were
allowed to be totally random, there was never a computer case when the
elevations of the two edges were the same, although it would happen if you let
the computer cycle for an extended period.
This is because two 5 digit numbers would have to match and that would
be only a one in 100,000 probability.
But in fact, there are 14 such points in the Great Pyramid
data and this number (14) repeats for several different kinds of matches. It gives the appearance that the builders
could hit these levels anytime they wanted to.
The entire highlighted section demonstrates a “very non-random”
appearance.
Perhaps some of the other occurrences highlighted in various
colors would have attracted more interest as well as those not marked. There is
only space for a few specific areas of interest to be discussed here.
In the first column is the layer number starting with the bedrock
being layer 1. Scroll down and count the
yellow highlights that indicate the accumulated elevation at each corner is the
same to 1/10th inch. Not counting the bedrock there are 13 and
counting the bedrock there are 14. Remember these points are over 1000 feet
apart and the results of stacking millions of 2.5 ton, roughly finished stones.
Now move over to the next columns and note that the
incremental block heights are calculated by subtracting succeeding accumulated
heights. The identical block heights are
marked in purple. Note there are 14.
Note that at layer 127 there is identical accumulated height and also
identical block height. The precision in
this area is far beyond what one might expect from random events.
The number 127 is a very significant number. Two times it is 254, the conversion from
metric to English. The reciprocal at
1/127 has repeating digits every 42 numbers. There are 127 primary helium isotopes.
In the eighth column, the differences
between incremental block heights on opposite edges, the times that the differences were absolute 0.10 were counted and
came up with 22. Ten were -0.10 and
twelve were opposite polarity at positive 0.10, shown in cyan. Twenty-two is
not fourteen. Then I noted there were
several reversals where the subsequent number is the exact magnitude, but
opposite polarity. These are marked in
red except where the 0.10 cells are already another color. Count them carefully and you find exactly 14
reversals.
Move over to tenth column and note there are 13 light blue
cells indicating 0.10 differences
in accumulated heights. Also in the same column there are 12 places marked in
red and two yellow where exact numbers are in sequence but this time the same
polarity. Actually this is a result of
repeats in the previous columns, but serves to highlight the methodology
begging for discovery. Below is a printout of column 10.
No doubt Sir Petrie would have done something with these
numbers had he suspected the patterns shown in this portion of the
spreadsheet. The fact that the
individual accumulated heights hit exactly the same on 14 different occasions
probably didn’t raise much interest, as one might tend to think that this is
something that could have statistically happened in the 201 occasions. But
perhaps it alone is quite significant.
If one assigns the computer the task of computing random
block heights and allows them to vary say plus or minus 20 inches within the
range from 20 to 60 inches, then with 1/10th inch increments there
are 400 possible block heights.
Therefore, in 201 possibilities we might expect a couple points where
one block height is the same as the one opposite on the distant corner and same
row. In actual computer models, this was proven generally true with a few
occasions when there were three blocks with the same height.
If the accumulated elevations (the raw Sir Petrie data) were
allowed to be totally random, there was never a computer case when the
elevations of the two edges were the same, although it would happen if you let
the computer cycle for an extended period.
This is because two 5 digit numbers would have to match and that would
be only a one in 100,000 probability.
But in fact, there are 14 such points in the Great Pyramid
data and this number (14) repeats for several different kinds of matches. It gives the appearance that the builders
could hit these levels anytime they wanted to.
The entire highlighted section demonstrates a “very non-random”
appearance.
Perhaps some of the other occurrences highlighted in various
colors would have attracted more interest as well as those not marked. There is
only space for a few specific areas of interest to be discussed here.
In the first column is the layer number starting with the bedrock
being layer 1. Scroll down and count the
yellow highlights that indicate the accumulated elevation at each corner is the
same to 1/10th inch. Not counting the bedrock there are 13 and
counting the bedrock there are 14. Remember these points are over 1000 feet
apart and the results of stacking millions of 2.5 ton, roughly finished stones.
Now move over to the next columns and note that the
incremental block heights are calculated by subtracting succeeding accumulated
heights. The identical block heights are
marked in purple. Note there are 14.
Note that at layer 127 there is identical accumulated height and also
identical block height. The precision in
this area is far beyond what one might expect from random events.
The number 127 is a very significant number. Two times it is 254, the conversion from
metric to English. The reciprocal at
1/127 has repeating digits every 42 numbers. There are 127 primary helium isotopes.
In the eighth column, the differences
between incremental block heights on opposite edges, the times that the differences were absolute 0.10 were counted and
came up with 22. Ten were -0.10 and
twelve were opposite polarity at positive 0.10, shown in cyan. Twenty-two is
not fourteen. Then I noted there were
several reversals where the subsequent number is the exact magnitude, but
opposite polarity. These are marked in
red except where the 0.10 cells are already another color. Count them carefully and you find exactly 14
reversals.
Move over to tenth column and note there are 13 light blue
cells indicating 0.10 differences
in accumulated heights. Also in the same column there are 12 places marked in
red and two yellow where exact numbers are in sequence but this time the same
polarity. Actually this is a result of
repeats in the previous columns, but serves to highlight the methodology
begging for discovery. Below is a printout of column 10.

This printout is anything but random. It appears to mimic an oscilloscope image
particular those representing portions of the earth’s Schumann Resonance. The
Schumann resonance is initiated by lightning but the actual resonation is due
to some natural phenomena in the atmosphere and crust.
The chances of all these marked events happening in random
numbers are nigh unto impossible to calculate.
It simply means the pyramid builders apparently had the inclination and
knowhow to stack the rocks with perhaps greater precision than we can
survey. It tells us that we should open
our eyes and minds to perhaps greater knowhow than we can imagine.
The next point is very important. In the computer world, we have ways of
checking data that we send over the wires.
It uses a method of counting data bits and the summation is checked
every now and then. In view of that background, see how the study started
below.
Believe it or not, what first attracted attention is that the
sum of the differences in accumulated
heights (tenth column summed and shown in blue at the bottom) totals to the
exact sidereal orbital period of Venus at 224.70.
(224.701 days is the modern
Sidereal number and 224.695 is the tropical year which also rounds to 224.70).
Keep in mind this is the sum of 201 separate two-digit numbers that result from
the differences of 402 numbers.
This seems like a terrific data check to me. Note in this case even the decimal
is in the right spot, adding to the unlikelihood of random occurrence.
In column 9 the sum divided by 4096 (2 doubled 12 times)
multiplied by 10 and squared yields 224.694684 where 224.69544 is the tropical
year at the 2000 Epoch.
A further attraction was that the top block heights of 22.4 and
22.5 on opposite edges (shown in light green). The average multiplied by 10 is 224.5. These could easily be accidents but when
weighed in light of the other accuracies, it begged for further digging.
Of course the skeptic will argue that if it had added to the
birth date of George Washington, one might also have been impressed. Therefore, there needs to be other “Venus
things” in the data to be a significant event.
Two more major statistical events resulted from the sum of
each of the two original Sir Petrie columns (2 and 5) to the 202 layer and
divided by 1024 (2 doubled 10 times), which gave the Venus synodic period shown
in dark green as 583.9535156 and 584.1729492. It could be the builders didn’t
particularly want to call attention to Venus, but just wanted some number not
earth oriented.
Synodic periods recorded in most scientific journals sort of
assumes Earth, Venus and the Sun as indifferent balls of something. To get the modern scientific synodic period
for Venus as 583.9214, the Supplement to the Astronomical Almanac treats the
surfaces of each Earth and Venus as you would the skin of a billiard ball or as
a point instead of an actual object. But
people don’t live on the whole skin or points.
They live at a certain location on the surface of the Earth. So the ancients would be interested in what
happened at specifically the location of the Great Pyramid, and not necessarily
something in general.
Look at the ingeniousness of the adding up a whole bunch of
numbers accurate to only 0.1 inch and halving down repeatedly to get greater
accuracy for the important number series.
This is a great way to compensate for our modern ignorance and lack of
knowhow. If ever there was a tool for awakening, this could be it.
The individual observer living on earth does not care what
is happening around the globe, but only at his/her place. Therefore, to some degree the synodic period
needs to be close to an integer so that the observer is back at the right place
at sunrise.
There are two major factors that impact the more exact
timing for an individual observer. One
is the latitude. Since the earth is
tilted about 23.439 degrees at this time, the theoretical point on the equator
sees the completion of the synodic period at a few hours different total time
than say somebody at 30 degrees north where the pyramids are located.
In our current era, the synodic period is roughly on cue
with the June and December solstices.
This means that at each end of the synodic period, the earth tilted
nearly full tilt the opposite direction.
The synodic period would be lengthened and shortened a few hours
depending on latitude alone. As it is
now, the corrections are additive in one cycle and subtractive in the next
cycle. This makes one synodic period
shorter than the integer and one longer from just this phenomenon alone, just
as suggested by the two numbers in dark green.
Of course, there are other local factors that can impact the local
synodic period slightly.
Some folks think that the Great Pyramid actually went on up
or else had a capstone. The top of the Great Pyramid is on the light speed
latitude 29.9792458 at times. Because the latitude varies as the axis angle of
tilt changes over very long periods, the latitude varies across the top of the
pyramid apparently about the distance the top is now. It is possible the only stones missing were
the finish stones.
If one uses Google Earth to look at the location of the top,
the angle of the scan distorts anything with height to it. Use the path portion
of the ruler tool and go around the base and then connect the diagonals. The intersection of the diagonals is very
close to the center and is close enough to find the light speed latitude. If
your GE is set to minutes and seconds, the light speed latitude is 29 d 58m
45.28 s. What does this say about the builder’s intelligence?
There are numerous other observations that seem to prove the
Sir Petrie data is exactly as the builders had intended for us to discover. It
is much easier to use the actual spreadsheet where the cells can be clicked on
to see the formulae. I will just
highlight one more major event at this time.
I figured if what I was saying was true, the series of
numbers where there were equal accumulated heights (yellow)
and the other series where there were equal block heights (purple) should have something important to say to
us. The graphics below indicate only the beginning of a very long and important
mathematical journey.
Note in the left column in yellow is the “equal elevation”
layer numbers. In the purple column is
the “equal block height” data displaced down “one” as suggested by the first
column data. The third column is the sum
of the first two. The fourth column is
the incremental differences from the
third column (42-6 = 36, 54-42 = 12 etc).
|
5
|
1
|
6
|
|
|
23
|
19
|
42
|
36
|
|
25
|
29
|
54
|
12
|
|
34
|
39
|
73
|
19
|
|
38
|
45
|
83
|
10
|
|
39
|
54
|
93
|
10
|
|
46
|
57
|
103
|
10
|
|
50
|
63
|
113
|
10
|
|
52
|
81
|
133
|
20
|
|
60
|
85
|
145
|
12
|
|
68
|
110
|
178
|
33
|
|
440
|
583
|
1023
|
17.20
|
|
|
205.682084781
|
|
|
|
|
qc width 205.68
|
|
|
Note that the sum of the first column is the ever-present
440 cps “middle A note on the piano” and perhaps the exact tone the Great
Pyramid allegedly produced. The sum of
the second column is the first three digits of the synodic period. The sum of
the third column is “one short” of the 1024 (2 to the 10th power). And the sum of the last column is 10 x A =
17.1828 rounded to 17.2.
The red number ties the whole affair together. It results from using the summation numbers
exactly as shown:
(583 – 440)1/2 x 17.2 = 205.682
Sir Petrie measured the Queen
Chamber with exhausting repetition and found the mean on one end to be 205.68.
This seems to just be pointing in some direction to link areas together and
eventually to indicate “How the Great
Pyramid Works”.
Below is a graphical
representation of the fourth column. It
appears to represent some waveform seen in acoustical analysis of resonance
chambers.

It seems possible
that the entire design intent of the Great Pyramid was to be self-deciphering
by using the dimensions of even fairly insignificant items. That idea would
require some type of knowhow far above even our modern computer technologies.
CONCLUSION
It would be simple to say something like, “Well so what. We know the pyramid builders were clever and capable, so if they precisely measured the blocks and stacked them to exact heights, what is the big deal?” One could imagine a 1000-foot length of hollow reeds glued together to make essentially a lengthy small tube. This tube filled with water would give precise levels over the extreme distances. We know they had the ability to measure with precision if they wanted to. When I was constructing buildings and couldn’t afford a transit, I used common garden hose to level the corners with water inside the hoses.
The big deal is the extreme complexities these assumptions
carry below the surface. It means each
individual “internal” block is a very slightly different height from one edge
clear through to the other edge of the pyramid except at course #127. This is not just the outside edge blocks, but
also all the internal blocks in the entire Great Pyramid.
While this level of precision is possible with crude tools
as suggested above, what in the universe would make somebody want to take such
extreme measures for a simple tomb or monument?
I can think of only one motivating force and it would be highly
spiritual. I am suggesting the Great Pyramid not only is a treasure-trove of
information, but also did something like providing spiritual gratification to
those who knew how to use it. And likely those who knew how to “use it” had not
a clue as to “how to build it”.
Perhaps you have noticed that nowhere within this document
does it even suggest that UFO’s or aliens needed to be involved. There is nothing in this data or physical
evidence to suggest lasers or high technology type of rock cutting or
placement. What seems obvious is that
these people had some “Ancient-knowhow” that we do not have today. I cannot
help but speculate that it was of some spiritual-like source or nature and
perhaps is available to us today if we would take the suggestions this data
seems to highlight. Perhaps people on the Internet will take this first step
that I have provided and build it into something much more spectacular.
Copyright 2017
J D Branson
Knowhow at ctcweb dot net
Comments
Post a Comment